


Language:
Español
linSmith
Intro
Tutorial
Screenshots
Download
Compile
Deb/rpm...
Translate
Changelog
Charts
Links
|
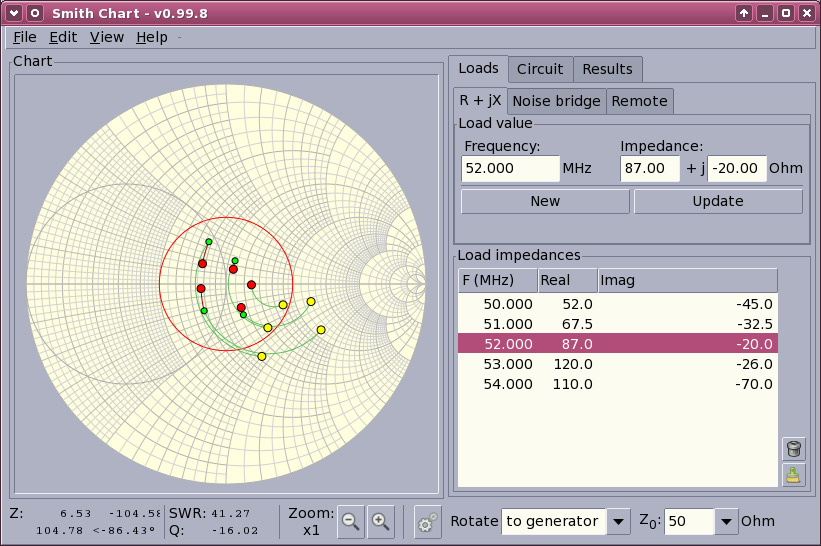
The main program, shown with a simple example problem. The right panel
is shown in the 'loads'-mode, with 5 frequencies and the corresponding
load impedances defined. (The example was taken from 'ARRL Antenna
Impedance Matching').
|
|
|
|
|
|
|
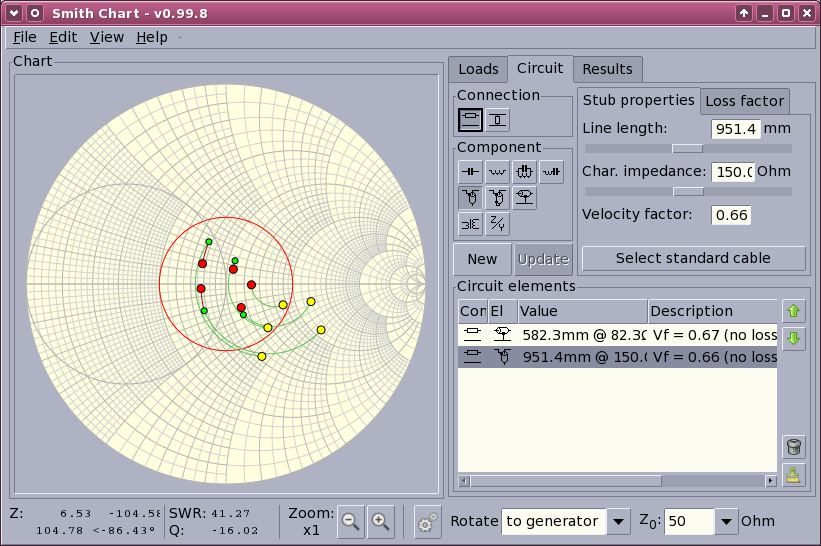
The right panel is on the 'elements'-page, showing the two components
used to adapt the loads to a fairly good result.
|
||
|
|
|
|
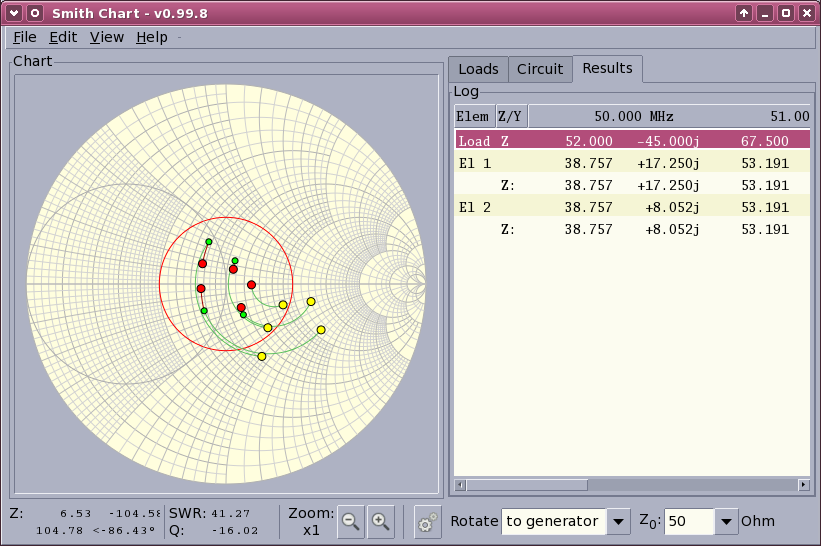
On the 'Log'-page, we can observe the numerical results after each
component.
|
||
|
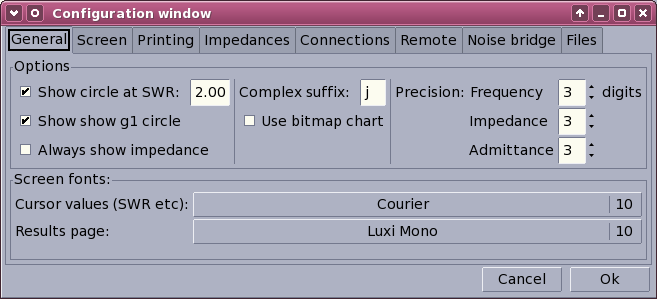
The first configuration page has a few general options, like, eg.
enabling or disabling the SWR circle and defining its diameter.
|
|
|
|
|
|
|
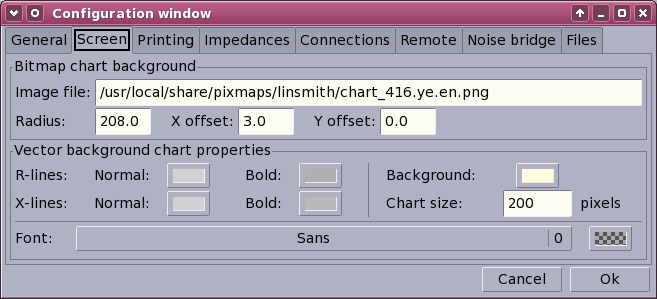
The second page defines how to render the chart background: its
size, and offsets in x and y direction.
|
||
|
|
|
|
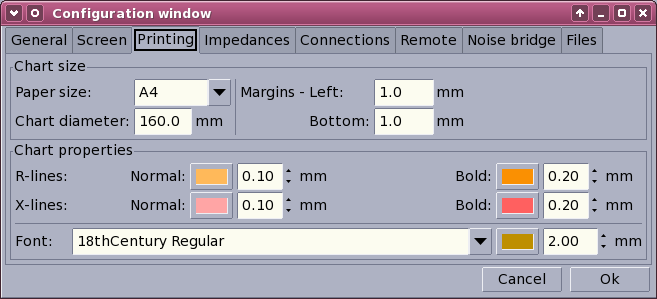
The next page permits defining the characteristics of the Postscript
output.
|
||
|
|
|
|
|
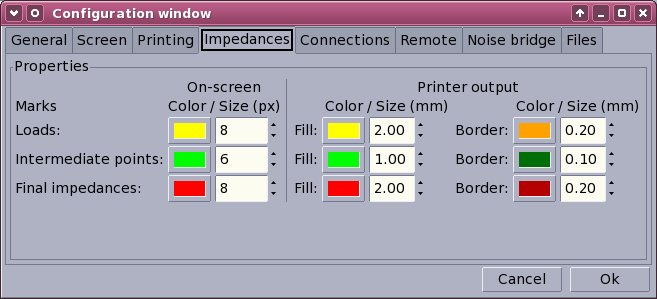
The 'Impendances' page defines the appearance of the impedance marks
for both the screen and print output.
|
||
|
|
|
|
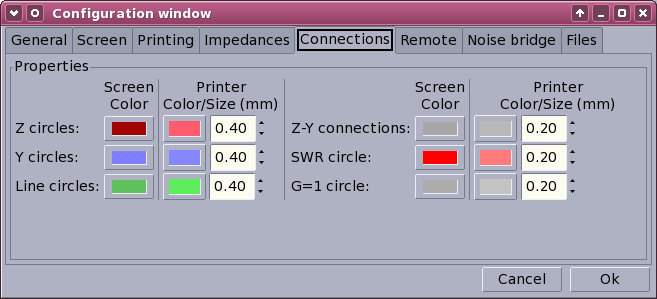
The 'Connections' tab defines the appearance of the connecting
lines on the chart: constant-R, -G, and transmission lines.
|
||
|
|
|
|
|
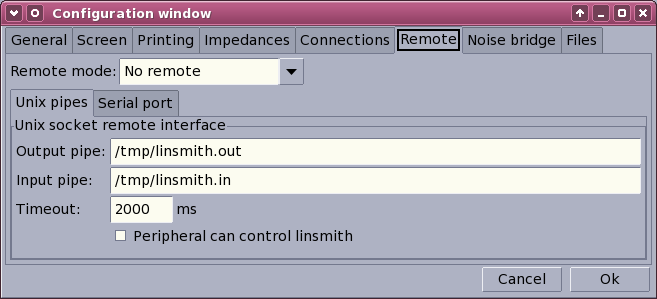
Recently added is the 'Remote' tab, where parameters for the
remote control of linSmith can be set. Instruments can send their
measurements to the program automatically.
|
||
|
|
|
|
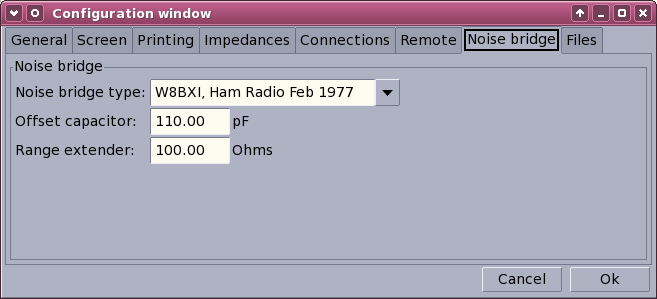
The 'Noise bridge' page permits selection of the noise bridge
type, and the fixed components, such as the parallel capacitor.
|
||
|
|
|
|
|
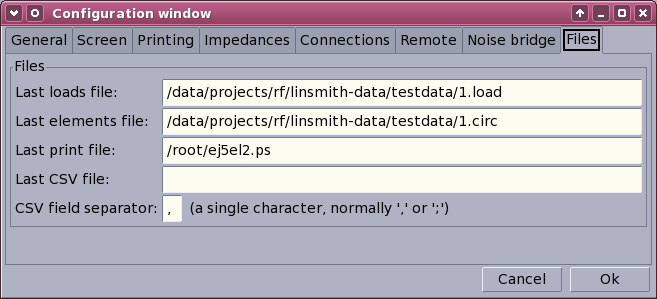
finally, the 'Files' page shows the last data and circuit files
selected, and permits the selection of the serial port for data
adquisition.
|
||
|
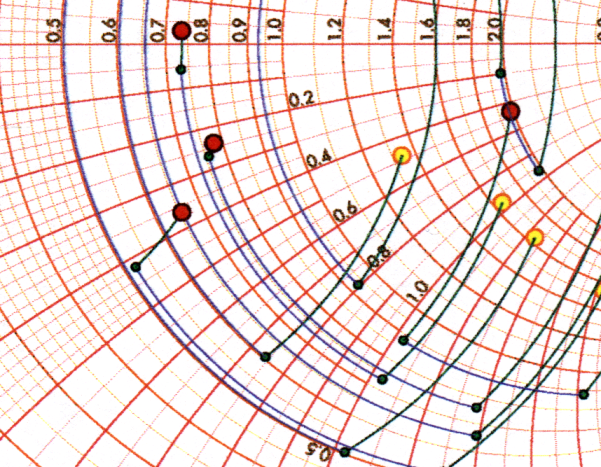
An example of a rather complex chart printed on a simple inkjet
printer.
|
|
| (c) John Coppens ON6JC/LW3HAZ |